Note
While the structure remains the same as the original deliverable, I have changed the visual style and content for purposes of portfolio addition without revealing confidential information.
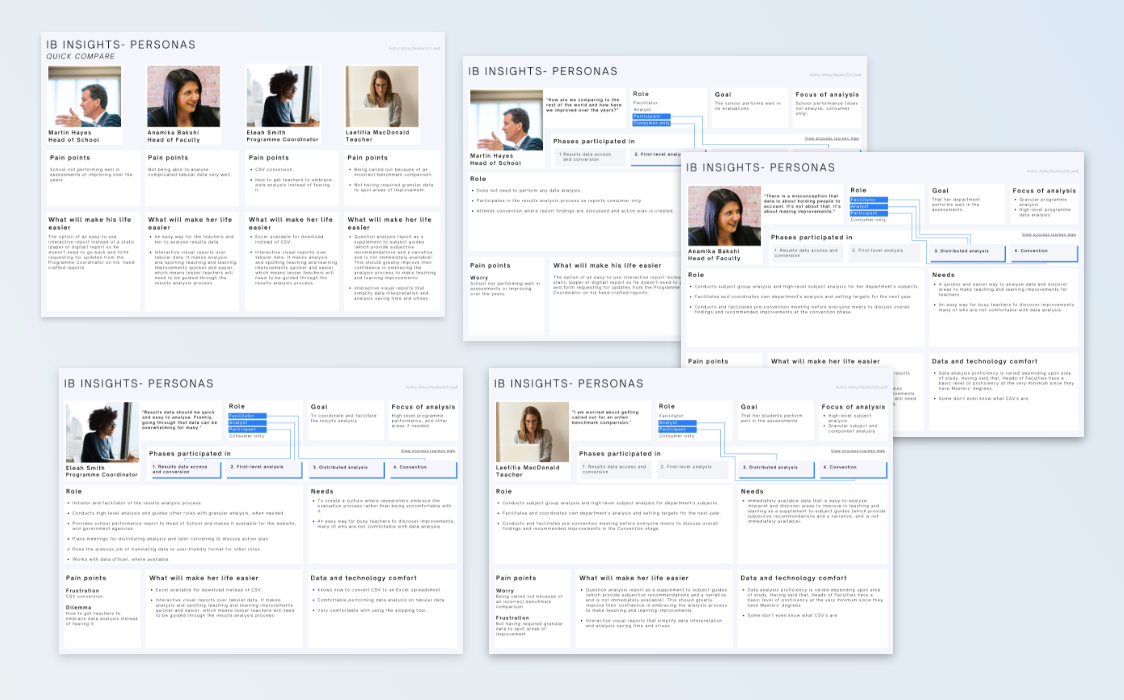
Background
I created these personas for a data visualisation web application I was working as UX Lead on. The personas were based on user research that I conducted with users to validate assumptions and get an in-depth understanding of how they all contributed to, and accomplished their individual goals, on a longer-than-a-year evaluation process.
Process and notable features
The three steps I used to create the personas, much like the obviousness of defining information architecture before interaction design were:
- Attribute definition- what attributes should the personas have that will provide value in context of the evaluation process and the data visualization application.
- Presentation definition- Defining the layout of the persona/ wireframing this unique template as also encompasses the phases of the evaluation process (which had its own deliverable- a hybrid process cum customer journey map).
- Content addition- Adding content to the attributes of the personas
Some unique features of these personas, so as to make it most useful to this project, is that it lets the stakeholder know at a glance:
- A quick comparison view which not only acts as a starting point to show all personas together but also to summarize and let stakeholders compare pain points and opportunities to help these personas with.
- What the different roles are and which ones are fulfilled by this persona,
- Which phase of a longitudinal process does this persona participate in.
- And the relation between these two- what role is the persona fulfilling in what stage of the longitudinal process.
- Pain points were categorized under worry, fear and frustration, thereby giving insight into the emotional response of the user profile in relation to the analysis process the data visualization app was about.


